跳转至

Linux内核监控与攻防应用笔记

这篇文章主要参考了Linux 内核监控在 Android 攻防中的应用,自用笔记

Kernel Tracing System 1012

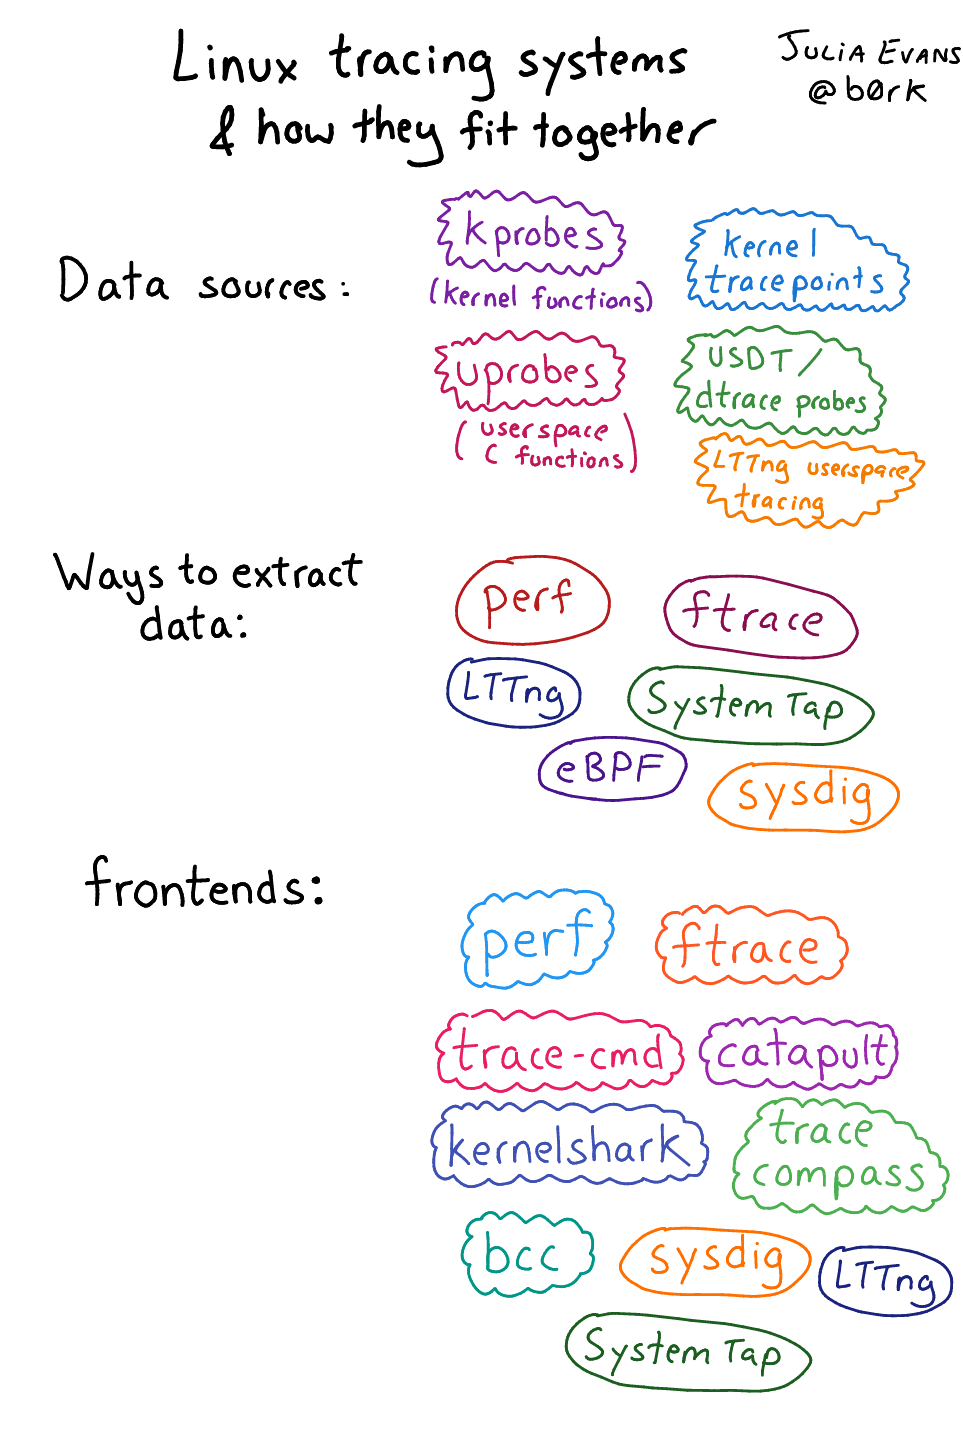
之前听说过很多内核中的监控方案,包括 strace,ltrace,kprobes,jprobes、uprobe、eBPF、tracefs、systemtab 等等,到底他们之间的的关系是什么,分别都有什么用呢。以及他们后续能否被用来作为攻防的输入。根据这篇文章1中的介绍,我们可以将其分为三个部分:

  • 数据源: 根据监控数据的来源划分,包括探针和断点两类
  • 采集机制: 根据内核提供给用户态的原始事件回调接口进行划分
  • 前端: 获取和解析监控事件数据的用户工具

Fig1

在开始介绍之前,先来看看我们能在内核监控到什么?

  • 系统调用
  • Linux 内核函数调用(例如,TCP 堆栈中的哪些函数正在被调用?)
  • 用户空间函数调用(malloc 是否被调用?)
  • 用户空间或内核中的自定义“事件

以上这些都是可能实现的,但是事实上追踪这些也是非常复杂的,下面就来一一进行说明。

Data source:KProbes34

KProbes 是 Linux 内核的一种调试机制,也可用于监视生产系统内的事件。简单来说,KProbes 可以实现动态内核的注入,基于中断的方法在任意指令中插入追踪代码,并且通过 pre_handler(探测前执行)/post_handler(探测后执行)/fault_handler 去接收回调。

<linux/kprobes.h>中定义了KProbes的结构

 1
 2
 3
 4
 5
 6
 7
 8
 9
10
struct kprobe {
    struct hlist_node hlist;                    /* Internal */
    kprobe_opcode_t addr;                       /* Address of probe */
    kprobe_pre_handler_t pre_handler;           /* Address of pre-handler */
    kprobe_post_handler_t post_handler;         /* Address of post-handler */
    kprobe_fault_handler_t fault_handler;       /* Address of fault handler */
    kprobe_break_handler_t break_handler;       /* Internal */
    kprobe_opcode_t opcode;                     /* Internal */        
    kprobe_opcode_t insn[MAX_INSN_SIZE];        /* Internal */
};

Example

一个官方案例如下

  1
  2
  3
  4
  5
  6
  7
  8
  9
 10
 11
 12
 13
 14
 15
 16
 17
 18
 19
 20
 21
 22
 23
 24
 25
 26
 27
 28
 29
 30
 31
 32
 33
 34
 35
 36
 37
 38
 39
 40
 41
 42
 43
 44
 45
 46
 47
 48
 49
 50
 51
 52
 53
 54
 55
 56
 57
 58
 59
 60
 61
 62
 63
 64
 65
 66
 67
 68
 69
 70
 71
 72
 73
 74
 75
 76
 77
 78
 79
 80
 81
 82
 83
 84
 85
 86
 87
 88
 89
 90
 91
 92
 93
 94
 95
 96
 97
 98
 99
100
101
102
103
104
105
106
107
108
109
110
111
112
113
114
115
116
117
118
119
120
121
122
123
124
125
126
127
128
129
130
/ SPDX-License-Identifier: GPL-2.0-only
/*
 * Here's a sample kernel module showing the use of kprobes to dump a
 * stack trace and selected registers when kernel_clone() is called.
 *
 * For more information on theory of operation of kprobes, see
 * Documentation/trace/kprobes.rst
 *
 * You will see the trace data in /var/log/messages and on the console
 * whenever kernel_clone() is invoked to create a new process.
 */

#define pr_fmt(fmt) "%s: " fmt, __func__

#include <linux/kernel.h>
#include <linux/module.h>
#include <linux/kprobes.h>

static char symbol[KSYM_NAME_LEN] = "kernel_clone";
module_param_string(symbol, symbol, KSYM_NAME_LEN, 0644);

/* For each probe you need to allocate a kprobe structure */
static struct kprobe kp = {
    .symbol_name    = symbol,
};

/* kprobe pre_handler: called just before the probed instruction is executed */
// 定义 pre_handler
static int __kprobes handler_pre(struct kprobe *p, struct pt_regs *regs) 
{
#ifdef CONFIG_X86
    pr_info("<%s> p->addr = 0x%p, ip = %lx, flags = 0x%lx\n",
        p->symbol_name, p->addr, regs->ip, regs->flags);
#endif
#ifdef CONFIG_PPC
    pr_info("<%s> p->addr = 0x%p, nip = 0x%lx, msr = 0x%lx\n",
        p->symbol_name, p->addr, regs->nip, regs->msr);
#endif
#ifdef CONFIG_MIPS
    pr_info("<%s> p->addr = 0x%p, epc = 0x%lx, status = 0x%lx\n",
        p->symbol_name, p->addr, regs->cp0_epc, regs->cp0_status);
#endif
#ifdef CONFIG_ARM64
    pr_info("<%s> p->addr = 0x%p, pc = 0x%lx, pstate = 0x%lx\n",
        p->symbol_name, p->addr, (long)regs->pc, (long)regs->pstate);
#endif
#ifdef CONFIG_ARM
    pr_info("<%s> p->addr = 0x%p, pc = 0x%lx, cpsr = 0x%lx\n",
        p->symbol_name, p->addr, (long)regs->ARM_pc, (long)regs->ARM_cpsr);
#endif
#ifdef CONFIG_RISCV
    pr_info("<%s> p->addr = 0x%p, pc = 0x%lx, status = 0x%lx\n",
        p->symbol_name, p->addr, regs->epc, regs->status);
#endif
#ifdef CONFIG_S390
    pr_info("<%s> p->addr, 0x%p, ip = 0x%lx, flags = 0x%lx\n",
        p->symbol_name, p->addr, regs->psw.addr, regs->flags);
#endif
#ifdef CONFIG_LOONGARCH
    pr_info("<%s> p->addr = 0x%p, era = 0x%lx, estat = 0x%lx\n",
        p->symbol_name, p->addr, regs->csr_era, regs->csr_estat);
#endif

    /* A dump_stack() here will give a stack backtrace */
    return 0;
}

/* kprobe post_handler: called after the probed instruction is executed */
// 定义 post_handler
static void __kprobes handler_post(struct kprobe *p, struct pt_regs *regs,
                unsigned long flags)
{
#ifdef CONFIG_X86
    pr_info("<%s> p->addr = 0x%p, flags = 0x%lx\n",
        p->symbol_name, p->addr, regs->flags);
#endif
#ifdef CONFIG_PPC
    pr_info("<%s> p->addr = 0x%p, msr = 0x%lx\n",
        p->symbol_name, p->addr, regs->msr);
#endif
#ifdef CONFIG_MIPS
    pr_info("<%s> p->addr = 0x%p, status = 0x%lx\n",
        p->symbol_name, p->addr, regs->cp0_status);
#endif
#ifdef CONFIG_ARM64
    pr_info("<%s> p->addr = 0x%p, pstate = 0x%lx\n",
        p->symbol_name, p->addr, (long)regs->pstate);
#endif
#ifdef CONFIG_ARM
    pr_info("<%s> p->addr = 0x%p, cpsr = 0x%lx\n",
        p->symbol_name, p->addr, (long)regs->ARM_cpsr);
#endif
#ifdef CONFIG_RISCV
    pr_info("<%s> p->addr = 0x%p, status = 0x%lx\n",
        p->symbol_name, p->addr, regs->status);
#endif
#ifdef CONFIG_S390
    pr_info("<%s> p->addr, 0x%p, flags = 0x%lx\n",
        p->symbol_name, p->addr, regs->flags);
#endif
#ifdef CONFIG_LOONGARCH
    pr_info("<%s> p->addr = 0x%p, estat = 0x%lx\n",
        p->symbol_name, p->addr, regs->csr_estat);
#endif
}

static int __init kprobe_init(void)
{
    int ret;
    kp.pre_handler = handler_pre;
    kp.post_handler = handler_post;

    ret = register_kprobe(&kp);     // 注册 kprobes
    if (ret < 0) {
        pr_err("register_kprobe failed, returned %d\n", ret);
        return ret;
    }
    pr_info("Planted kprobe at %p\n", kp.addr);
    return 0;
}

static void __exit kprobe_exit(void)
{
    unregister_kprobe(&kp);    // 注销 kprobes
    pr_info("kprobe at %p unregistered\n", kp.addr);
}

module_init(kprobe_init)
module_exit(kprobe_exit)
MODULE_LICENSE("GPL");

上述的案例中,每当系统中进程调用kernel_clone(),就会触发handler,从而在dmesg中输出堆栈和寄存器的信息。同时也可以看出,为了兼容不同的系统架构,这里的模块案例做了不同的处理。

原理

kprobe基于中断实现。当 kprobe 被注册后,内核会将目标指令进行拷贝并将目标指令的第一个字节替换为断点指令(比如 i386 和 x86_64 架构中的 int 3),随后当CPU执行到对应地址时,中断会被触发从而执行流程会被重定向到关联的 pre_handler 函数;当单步执行完拷贝的指令后,内核会再次执行 post_handler (若存在),从而实现指令级别的内核动态监控。也就是说,kprobe 不仅可以跟踪任意带有符号的内核函数,也可以跟踪函数中间的任意指令。

Data source:uprobe567

顾名思义,uprobe就是监控用户态函数/地址的探针,以一个例子作为说明

Example

 1
 2
 3
 4
 5
 6
 7
 8
 9
10
11
12
13
//test.c
#include <stdio.h>
#include <stdlib.h>

void foo()
{
    printf("foo() called\n");
}
int main()
{
    foo();
    return 0;
}

编译结束后,查看foo符号的地址,然后告诉内核监控该地址的调用

 1
 2
 3
 4
 5
 6
 7
 8
 9
10
11
12
13
14
15
16
17
18
19
20
21
22
23
$ gcc test.c -o test
$ readelf -s test | grep foo
    28: 0000000000001149    26 FUNC    GLOBAL DEFAULT   16 foo
# echo 'p /home/xxx/Temp/test:0x1149' > /sys/kernel/debug/tracing/u
probe_events
# echo 1 > /sys/kernel/debug/tracing/events/uprobes/p_test_0x1149/enable
# echo 1 > /sys/kernel/debug/tracing/tracing_on
$ ./test && ./test
#  cat /sys/kernel/debug/tracing/trace
# tracer: nop
#
# entries-in-buffer/entries-written: 2/2   #P:24
#
#                                _-----=> irqs-off/BH-disabled
#                               / _----=> need-resched
#                              | / _---=> hardirq/softirq
#                              || / _--=> preempt-depth
#                              ||| / _-=> migrate-disable
#                              |||| /     delay
#           TASK-PID     CPU#  |||||  TIMESTAMP  FUNCTION
#              | |         |   |||||     |         |
            test-4182    [017] DNZff  4429.550406: p_test_0x1149: (0x5fc739ab0149)
            test-4183    [017] DNZff  4429.551239: p_test_0x1149: (0x602ec9609149)

监控结束之后,记得还要关闭监控

1
2
3
# echo 0 > /sys/kernel/debug/tracing/tracing_on
# echo 0 > /sys/kernel/debug/tracing/events/uprobes/p_test_0x1149/enable
# echo > /sys/kernel/debug/tracing/uprobe_events

原理

uprobes在Linux 3.5版本被添加到内核中并在Linux 3.14进行更新。uprobe共有两种实现方式,分别为debugfstracefs,工作的流程如下(此处参考源码

将 uprobe 事件写入 uprobe_events ,调用链为

(在旧版本的内核中可能为 probes_write()->create_trace_uprobe()

  • kern_path(),打开目标ELF文件并获取文件inode
  • alloc_trace_uprobe(),分配一个trace_uprobe结构体并初始化
  • register_trace_uprobe(),注册trace_uprobeprobe_event ,将trace_uprobe添加到事件tracer中,并建立对应的 uprobe debugfs 目录,即上文示例中的 p_test_0x1149
  • 当已经注册了 uprobe 的 ELF 程序被执行时,可执行文件会被 mmapuprobe_mmap()) 映射到进程的地址空间,同时内核会将该进程虚拟地址空间中对应的 uprobe 点替换成断点指令。当目标程序指向到对应的 uprobe 地址时,会触发断点,从而触发到 uprobe 的中断处理流程 arch_uprobe_exception_notify,进而在内核中打印对应的信息。

与 kprobe 类似,我们可以在触发 uprobe 时候根据对应寄存器去提取当前执行的上下文信息,比如函数的调用参数等。使用 uprobe 的好处是我们可以获取许多对于内核态比较抽象的信息,比如 bash 中 readline 函数的返回、SSL_read/write 的明文信息等。

Data source:tracepoints58910


最后更新: 2024-07-06
创建日期: 2024-05-30

评论